


运行环境
CentOS7虚机 2核2G
Docker安装
# 安装docker社区版
yum remove docker \
docker-client \
docker-client-latest \
docker-common \
docker-latest \
docker-latest-logrotate \
docker-logrotate \
docker-selinux \
docker-engine-selinux \
docker-engine && \
yum install -y yum-utils device-mapper-persistent-data lvm2 && \
yum-config-manager --add-repo http://mirrors.aliyun.com/docker-ce/linux/centos/docker-ce.repo && \
yum makecache fast && \
yum install docker-ce

# 启动服务
systemctl enable docker
systemctl start docker
Prometheus 安装
下载安装包
你可以在浏览器上访问 https://prometheus.io/download/ ,下载所需版本,传递到
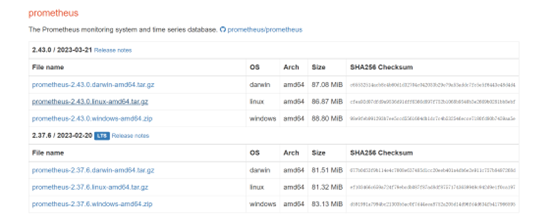
解压
tar xvfz prometheus-2.43.0.linux-amd64.tar.gz
cd prometheus-2.43.0.linux-amd64
# 测试命令是否能使用
./prometheus --help
配置Prometheus
配置文件在 $PROMETHEUS_HOME/prometheus.yml 官方已经在该文件写好了示例配置
cd prometheus-2.43.0.linux-amd64

cat prometheus.yml
#############完整内容如下#############
# my global config
global:
  scrape_interval: 15s # Set the scrape interval to every 15 seconds. Default is every 1 minute.
  evaluation_interval: 15s # Evaluate rules every 15 seconds. The default is every 1 minute.
  # scrape_timeout is set to the global default (10s).

# Alertmanager configuration
alerting:
  alertmanagers:
    - static_configs:
        - targets:
          # - alertmanager:9093

# Load rules once and periodically evaluate them according to the global 'evaluation_interval'.
rule_files:
  # - "first_rules.yml"
  # - "second_rules.yml"

# A scrape configuration containing exactly one endpoint to scrape:
# Here it's Prometheus itself.
scrape_configs:
  # The job name is added as a label `job=<job_name>` to any timeseries scraped from this config.
  - job_name: "prometheus"

    # metrics_path defaults to '/metrics'
    # scheme defaults to 'http'.

    static_configs:
      - targets: ["localhost:9090"]
在配置文件中有三个配置块: global、rule_files和scrape_configs。
- global全局块控制Prometheus服务器的全局配置。我们现在有两个选择。
- scrape_interval控制Prometheus抓取目标的频率。您可以针对单个目标重写此操作。在本例中,全局设置是每15秒抓取一次。
- evaluation_interval选项控制Prometheus计算规则的频率。普罗米修斯使用规则来创建新的时间序列并生成警报。
- rule_files块指定了我们希望Prometheus服务器加载的任何规则的位置。现在我们没有规则。
- scrape_configs控制Prometheus监控的资源。由于Prometheus还将自己的数据作为HTTP端点公开,因此它可以抓取和监视自己的运行状况。在默认配置中,有一个名为prometheus的作业,它抓取由prometheus服务器公开的时间序列数据。该作业包含一个静态配置(static_configs)的目标,即端口9090上的本地主机。
- 这个作业将会监控本机性能,你还可以通过导航到它自己的度量端点:http://localhost:9090/metrics来验证Prometheus正在提供关于它自己的度量。
启动Prometheus
./prometheus --config.file=prometheus.yml
Web控制台
访问http://192.168.217.134:9090/graph (192.168.217.134是我的虚机ip,因为用了NAT,所以可以访问到这个网段)
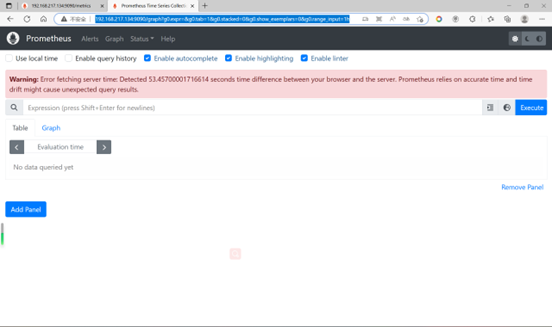
时间对不上
上述页面提示Prometheus服务端和浏览器时间对不上,先查看下本地浏览器电脑(我这里用的是Win11)ntp时间同步服务器
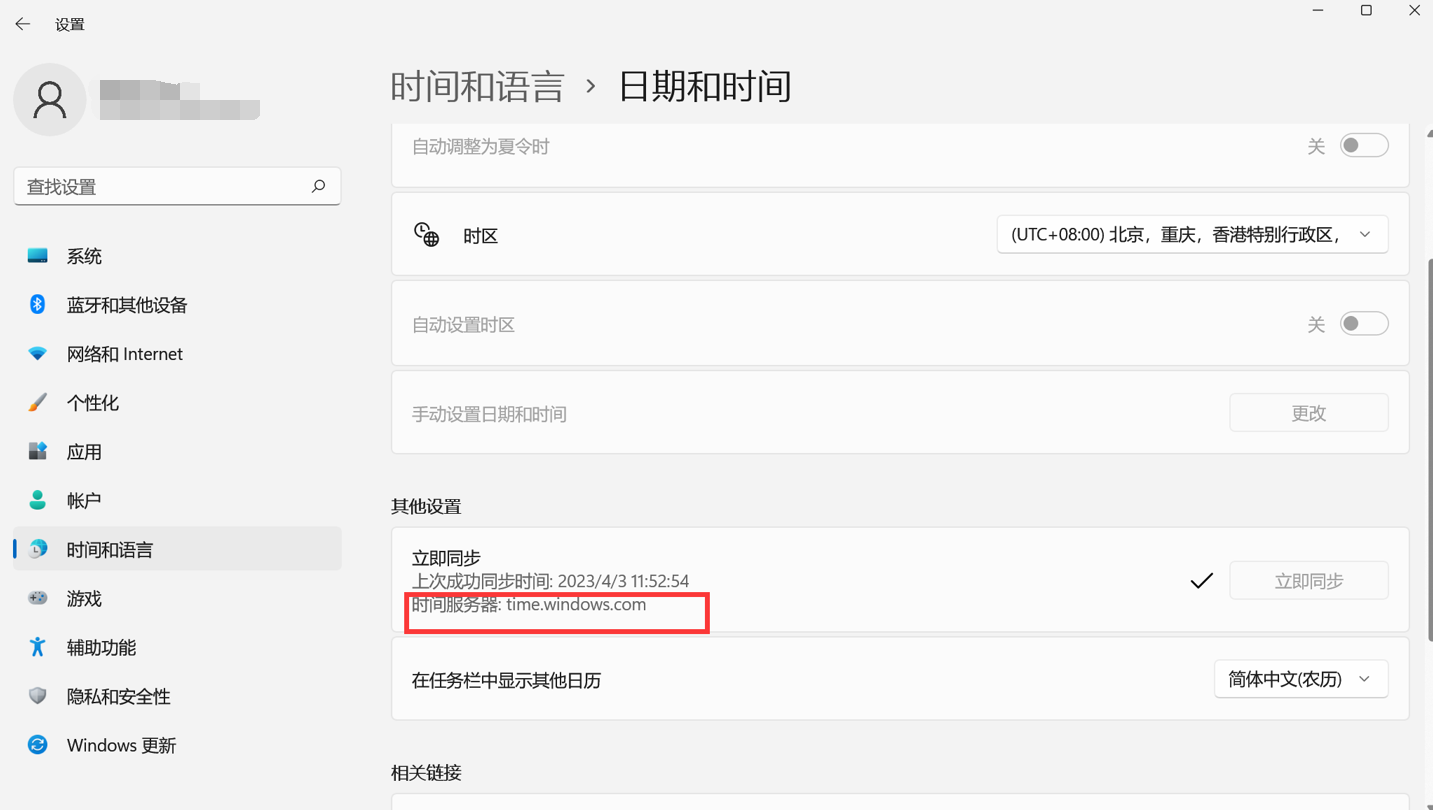
到Promethus所在的linux上
yum -y install ntp
systemctl enable ntpd
ntpdate time.windows.com
重启Promethus,访问web,问题消失
Grafana 安装
安装部署
# 安装
wget https://dl.grafana.com/enterprise/release/grafana-enterprise-9.4.7-1.x86_64.rpm
yum install grafana-enterprise-9.4.7-1.x86_64.rpm
# 启动服务
systemctl start grafana-server
systemctl enable grafana-server
# 修改密码(xxx)
grafana-cli admin reset-admin-password xxx
Web控制台
访问 http://192.168.217.134:3000/login
- 帐号:admin
- 密码:185123456
测试和Prometheus的联动
启动一个本机docker服务,让Prometheus去获取该服务的数据
# 启动node-exporter
docker run --name=node-exporter -p 9100:9100 -itd prom/node-exporter

# 编辑prometheus配置
vim $PROMETHEUS_HOME/prometheus.yml
#########完整内容如下#############
# my global config
global:
  scrape_interval: 15s # Set the scrape interval to every 15 seconds. Default is every 1 minute.
  evaluation_interval: 15s # Evaluate rules every 15 seconds. The default is every 1 minute.
  # scrape_timeout is set to the global default (10s).

# Alertmanager configuration
alerting:
  alertmanagers:
    - static_configs:
        - targets:
          # - alertmanager:9093

# Load rules once and periodically evaluate them according to the global 'evaluation_interval'.
rule_files:
  # - "first_rules.yml"
  # - "second_rules.yml"

# A scrape configuration containing exactly one endpoint to scrape:
# Here it's Prometheus itself.
scrape_configs:
  # The job name is added as a label `job=<job_name>` to any timeseries scraped from this config.
  - job_name: "prometheus"

    # metrics_path defaults to '/metrics'
    # scheme defaults to 'http'.

    static_configs:
      - targets: ["localhost:9090"]

  - job_name: 'node-exporter'
    static_configs:
      - targets: ['localhost:9100']
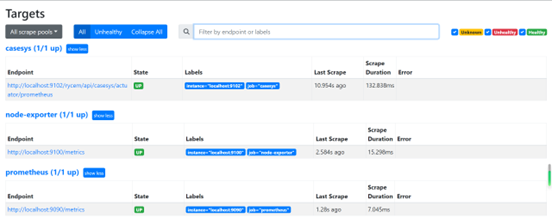
重启Prometheus,访问 http://192.168.217.134:9090/targets?search=,此时出现了两个服务被Prometheus监控着
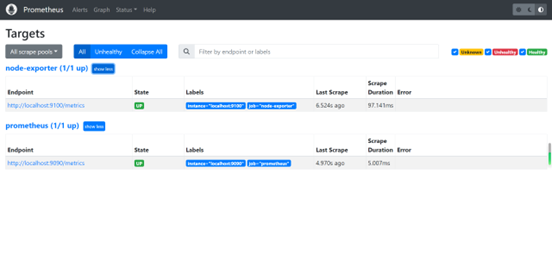
访问 http://192.168.217.134:9100/metrics ,同样可以获取到node-exporter这个服务的监控信息
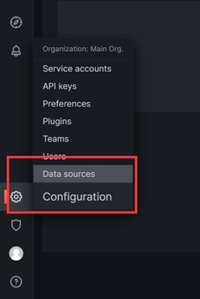
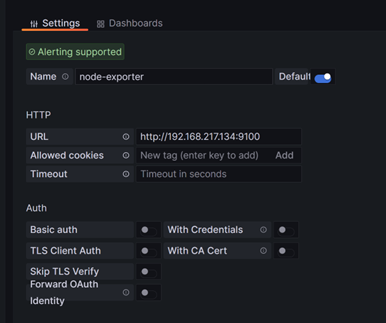
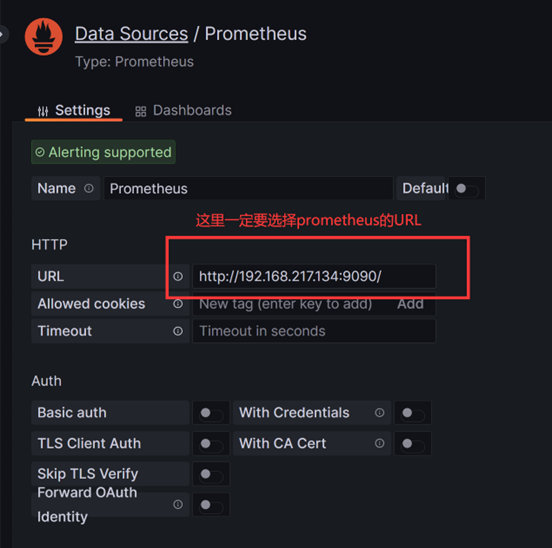
配置Grafana的Prometheus数据源
- 配置数据源
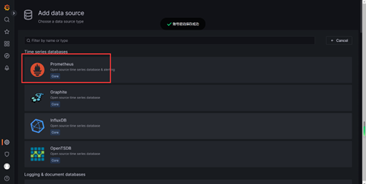
- 选择Prometheus
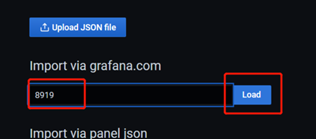
创建仪表盘
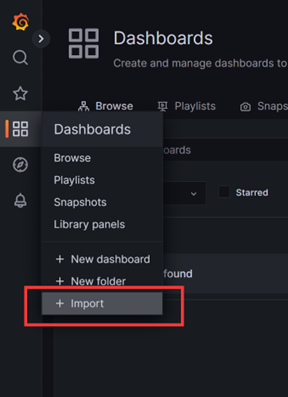
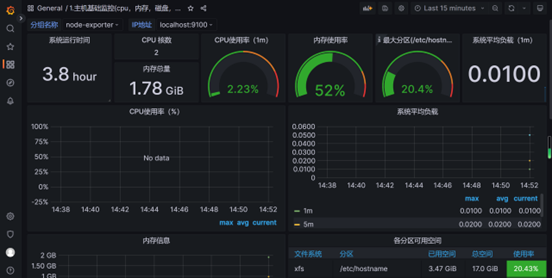
选择8019(Grafana官方有一些用户上传的仪表盘配置,通过代码直接使用)
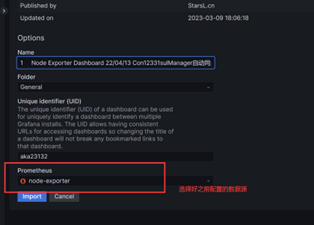
仪表盘就可以显示了!!
监控CEM微服务
改造CEM微服务
首先确保pom.xml下有如下两个依赖
其中,micrometer-registry-prometheus是将actuator收集到的监控信息转成prometheus格式
<dependency>
    <groupId>org.springframework.boot</groupId>
    <artifactId>spring-boot-starter-actuator</artifactId>
</dependency>
<dependency>
    <groupId>io.micrometer</groupId>
    <artifactId>micrometer-registry-prometheus</artifactId>
</dependency>
bootstrap.yml加上如下配置
management:
  endpoints:
    web:
      exposure:
        include: "*"
  metrics:
    tags:
      application: ${spring.application.name}
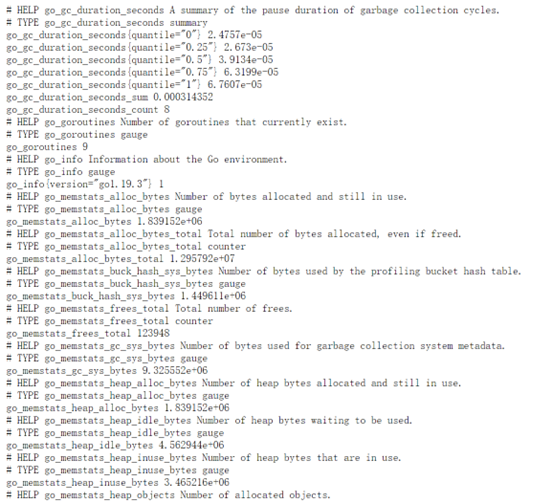
本地自启该微服务,访问 http://127.0.0.1:9102/rycem/api/casesys/actuator/prometheus,可以获取到已被转换成prometheus格式的监控和信息
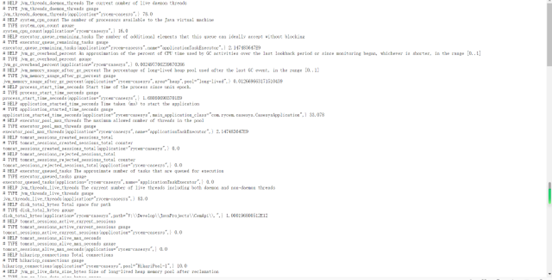
之所以URI带上了/rycem/api/casesys/是因为:
server:
  port: 9102
  servlet:
    context-path: /rycem/api/casesys
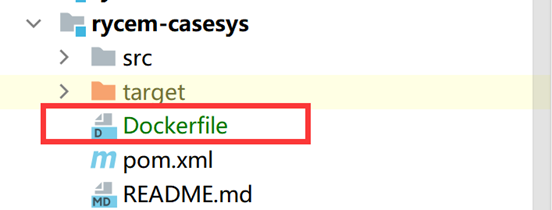
部署CEM微服务
编写一个Dockerfile,就在casesys模块的根目录下
# Docker image for springboot application
# VERSION 0.0.1
# Author: Tony Chen

### 基础镜像,使用alpine操作系统,openjkd使用8u201
FROM openjdk:8

#作者
MAINTAINER Tony Chen <xxxxxxxx@xxxx.com.cn>

#系统编码
ENV LANG=C.UTF-8 LC_ALL=C.UTF-8

#应用构建成功后的jar文件被复制到镜像内,名字也改成了app.jar
ADD target/rycem-casesys.jar rycem-casesys.jar

#启动容器时的进程
ENTRYPOINT ["java","-jar","/rycem-casesys.jar"]

#暴露9102端口
EXPOSE 9102
配置idea的启动项
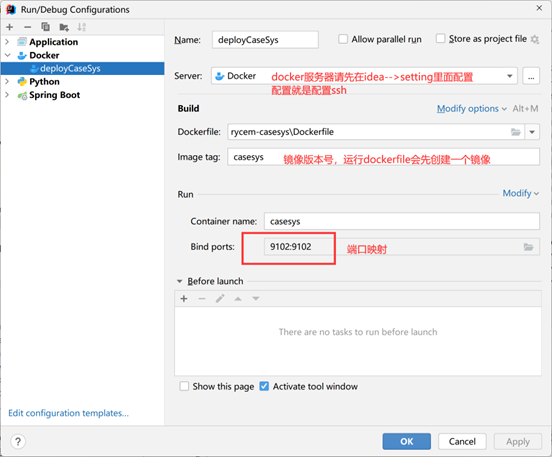
运行该配置项
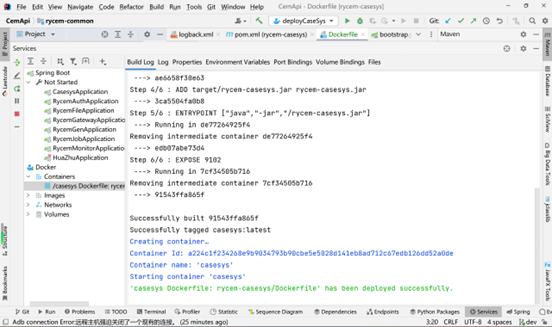
此时,微服务就可以正常使用了,访问 http://192.168.217.134:9102/rycem/api/casesys/doc.html#/home 也没有任何问题,Swagger文档正常使用,可以直接调接口
配置Prometheus
vim $PROMETHEUS_HOME/prometheus.yml
#################################
# my global config
global:
  scrape_interval: 15s # Set the scrape interval to every 15 seconds. Default is every 1 minute.
  evaluation_interval: 15s # Evaluate rules every 15 seconds. The default is every 1 minute.
  # scrape_timeout is set to the global default (10s).

# Alertmanager configuration
alerting:
  alertmanagers:
    - static_configs:
        - targets:
          # - alertmanager:9093

# Load rules once and periodically evaluate them according to the global 'evaluation_interval'.
rule_files:
  # - "first_rules.yml"
  # - "second_rules.yml"

# A scrape configuration containing exactly one endpoint to scrape:
# Here it's Prometheus itself.
scrape_configs:
  # The job name is added as a label `job=<job_name>` to any timeseries scraped from this config.
  - job_name: "prometheus"

    # metrics_path defaults to '/metrics'
    # scheme defaults to 'http'.

    static_configs:
      - targets: ["localhost:9090"]

  - job_name: 'node-exporter'
    static_configs:
      - targets: ['localhost:9100']
  - job_name: 'casesys'
    metrics_path: '/rycem/api/casesys/actuator/prometheus'
    static_configs:
      - targets: ['localhost:9102']
启动prometheus
./prometheus --config.file=prometheus.yml
访问 http://192.168.217.134:9090/targets?search=,所有服务都是可以监控到的
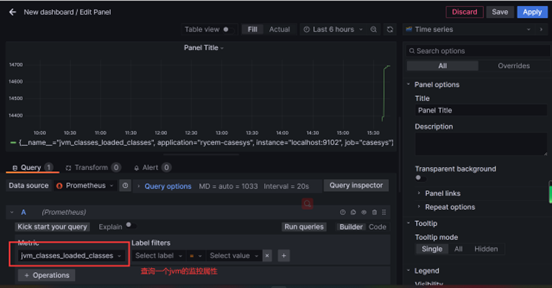
Grafana配置
选择数据源
选择监控信息
评论区